使用Azure Application Insights监测你的应用 (三) - Snapshot Debugger
前言
很多时候, 即使系统记录了异常日志, 但是由于信息的不全, 技术人员还是难以定位到具体问题, 而Snapshot Debugger不但记录了异常发生时的堆栈信息, 同时也记录了当时临时变量的信息, 技术人员可以根据这些快速的定位和排查问题。
1. 什么是Snapshot Debugger
简而言之, 它是发生异常时, Application Insights收集的一个快照, 快照包含了生异常时源代码和变量的状态。
Note: Snapshot Debugger仅支持 .NET(4.5+) 或 .NET Core(2.0+)的应用程序
2. 如何启用
2.1 安装SDK包
dotnet add package Microsoft.ApplicationInsights.SnapshotCollector
2.2 在Startup类中启用
using Microsoft.ApplicationInsights.SnapshotCollector;

public void ConfigureServices(IServiceCollection services)
{
  // This code adds other services for your application.
  services.AddMvc();

  services.AddSnapshotCollector((configuration) => Configuration.Bind(nameof(SnapshotCollectorConfiguration), configuration));
}
2.3 在appsettings.json中添加配置
Note:以下配置中的所有设置都是可选的。 以下示例显示与默认配置等效的配置
{
  "SnapshotCollectorConfiguration": {
    "IsEnabledInDeveloperMode": false,
    "ThresholdForSnapshotting": 1,
    "MaximumSnapshotsRequired": 3,
    "MaximumCollectionPlanSize": 50,
    "ReconnectInterval": "00:15:00",
    "ProblemCounterResetInterval":"1.00:00:00",
    "SnapshotsPerTenMinutesLimit": 1,
    "SnapshotsPerDayLimit": 30,
    "SnapshotInLowPriorityThread": true,
    "ProvideAnonymousTelemetry": true,
    "FailedRequestLimit": 3
  }
}
3. 调试问题
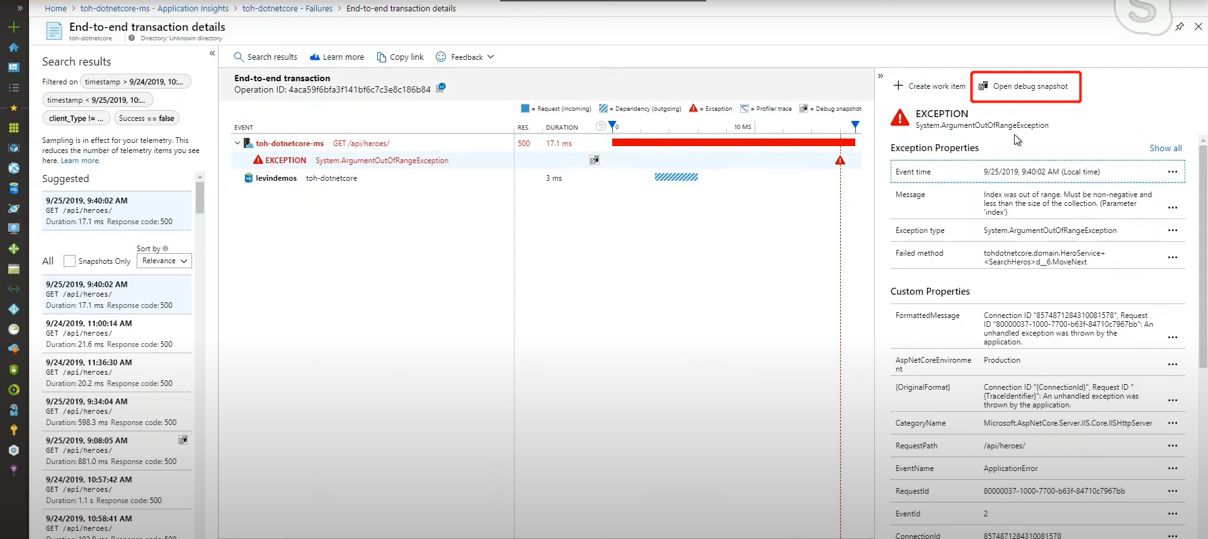
当遇到异常的时候, 导航到异常信息页, 点击右上角的Open debug snapshot按钮, 进入SnapShot Debugger页面:
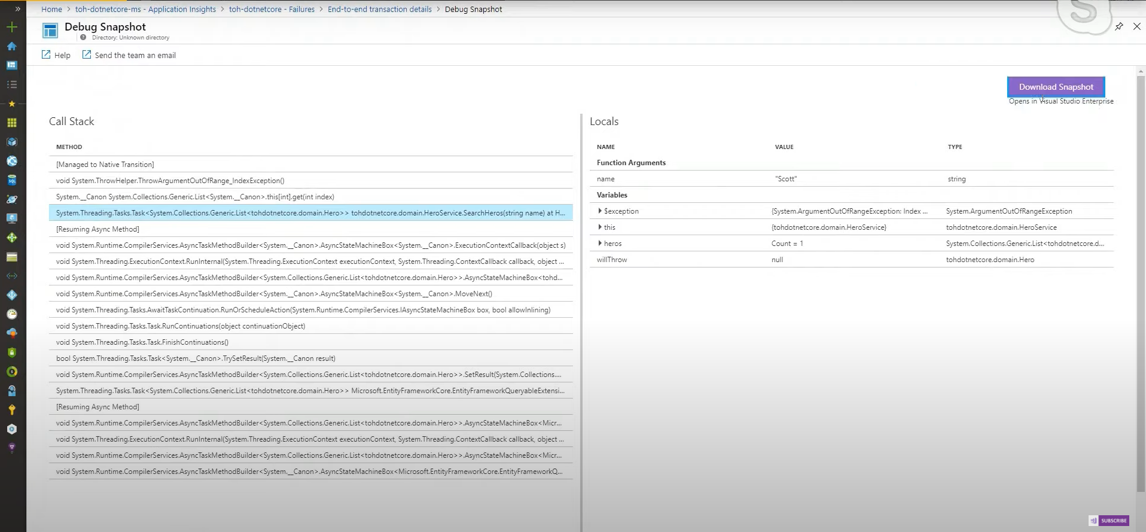
 在SnapShot Debugger页面, 你可以看到异常的堆栈信息, 也可以同时看到对应变量的值
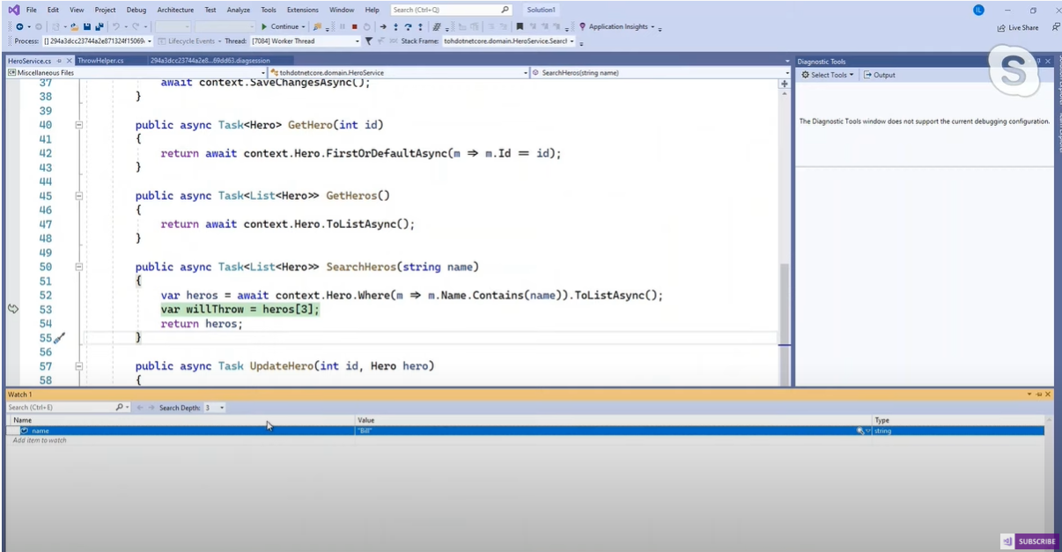
 如果SnapShot Debugger的信息还不够, 可以点击右上角的Download, 下载快照, 加载到Visual Studio中, 运行调试会话,可以快速确定导致异常的代码行。